Using CERN’s Root Library for Plotting
This is a post about something I did at least a year ago. I was modifying the firmware of a board as a customer wanted to change the way calibration of the product worked. The old method used a table containing points in a curve, each point contained the desired set point, and the actual value you get. The code then interpolated between the points in the curve as needed to get the actual value you need to set in order to get the desired value.
The customer wanted to use a single polynomial expression for calibration instead as that is what their existing products used. The new system would only need the coefficients of the polynomial instead of the large table of numbers. I wanted to experiment a bit with the polynomial code I had just written on the PC and at the time I did not know Scilab or numpy/matplotlib, but I had just read about CERN’s Root library which is a C++ library that includes really good plotting libraries. So I thought I’d try it out.
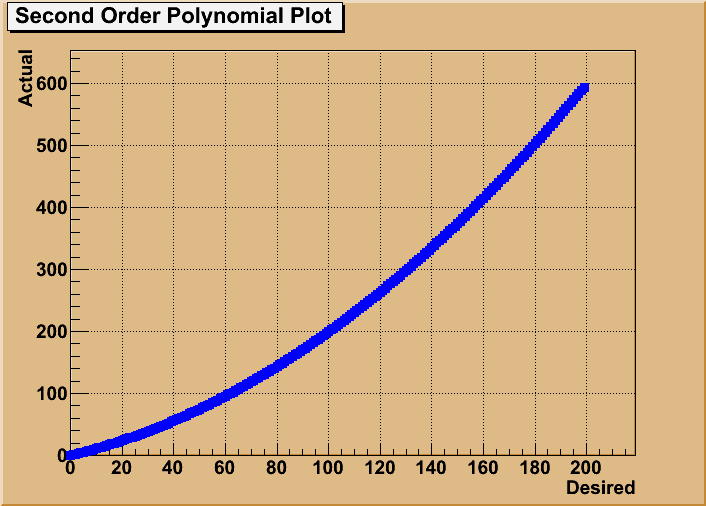
As you can see the plots look really good. Although I haven’t really used Root since I still remember it can sometimes consider it for doing plots even though I typically choose Gnuplot or matplotlib. On big advantage is that because it is a C++ library I can use the C code I wrote for the firmware directly without modification.
c++