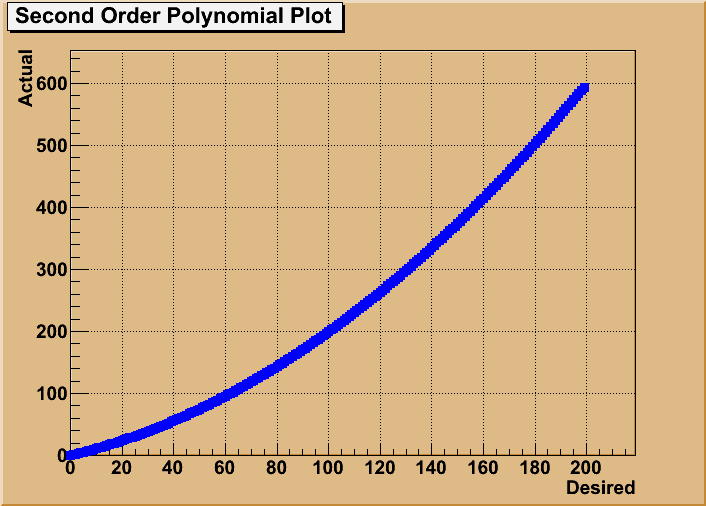
This is a post about something I did at least a year ago. I was modifying the firmware of a board as a customer wanted to change the way calibration of the product worked. The old method used a table containing points in a curve, each point contained the desired set point, and the actual value you get. The code then interpolated between the points in the curve as needed to get the actual value you need to set in order to get the desired value.
The customer wanted to use a single polynomial expression for calibration instead as that is what their existing products used. The new system would only need the coefficients of the polynomial instead of the large table of numbers. I wanted to experiment a bit with the polynomial code I had just written on the PC and at the time I did not know Scilab or numpy/matplotlib, but I had just read about CERN’s Root library which is a C++ library that includes really good plotting libraries. So I thought I’d try it out.
As you can see the plots look really good. Although I haven’t really used Root since I still remember it can sometimes consider it for doing plots even though I typically choose Gnuplot or matplotlib. On big advantage is that because it is a C++ library I can use the C code I wrote for the firmware directly without modification.
The version control system I use at work and home is Mercurial and I have been trying to learn more about it recently. What I want to do at the moment is have all of my repos stored in a central location so I can make sure they are backed up. I’d also like to be able to get the repos from any computer at work.
As it turns out Mercurial has a built-in webserver and this can handle multiple repositories. So created a directory on my computer where I put all my projects and then I’ve setup a script that will start-up the Mercurial webserver.
To set all this up I first created a directory, “/var/hg”, and in this directory is a sub directory called “repos” and a configuration file called “hgweb.config”. An example of the contents of this file are below.
[collections]
repos/ = repos/

[web]
contact=someemail@somedomain.com
description=some description here
allow_archive = bz2 gz zip
After doing this I then put all of my repositories in the repos directory, each repository can have it’s own local web configuration. This is a quick shell snippet that will launch a Mercurial webserver.
hg serve –webdir-conf /var/hg/hgweb.config
Thats it! Well… mostly anyway. I have missed of some detail as I can’t remember exactly what I did. Perhaps I should start recording the things I do step by step here so I cant forget.
Last time I ran an example sketch and then wrote my own that prints “Hello World” in bright colours. Now I want to play around with some of the basic shapes that Processing provides. From the documentation it looks like the 2D primitives are the arc, ellipse, line, point, quad, rect, and triangle.
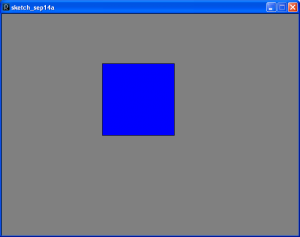
The first one I’m going to play with is the rect() primitive, so I wrote a simple sketch to draw one. All it does is set the window size then draw a rectangle somewhere in the window.
The rect() function takes four parameters as inputs, the first two are the x and y co-ordinates of where to start drawing. The second two are the height and width of the rectangle. Then I thought it would be cool if I made it follow the mouse, this as it turns out is really easy. In the draw function you get a couple of variables you can use for this, mouseX and mouseY. They hold the x and y co-ordinates of where the mouse is so all I have to do is put the call to rect() into the draw loop then use the mouse co-ordinates to set that starting position of the rectangle.
rect(mouseX, mouseY, 155, 155);
This code worked ok but the viewport filled up with loads of rectangles as you moved the mouse really quickly. I wanted just a single rectangle that followed the mouse. So I added some extra lines of code that drew another rectangle over the whole viewport to clear it then draw the smaller rectangle. I also thought it would look much nicer if the mouse cursor was always located in the centre of the rectangle rather than at the top left-hand corner. So to do this I subtracted half the width of the rectangle from the x co-ordinate or the mouse cursor, and did the same with the height and y co-ordinate. This kept the mouse cursor roughly in the middle of the rectangle.
To draw the rectangle over the entire viewport I two other special variables, width and height. These are set to the width and height of the window you are using. The code for all of this is below.
Earlier I was converting a Scilab simulation into C and I had the code emit a load of text files containing the data because I didn’t want to do any plotting or UI stuff in C. But I still wanted to plot the data so I can quickly check everything’s working. I also wanted to do some post processing of the data too… well that’s Python really shines in my opinion. I fired up IPython and used Numpy and Matplotlib.
 import numpy as np
 import matplotlib.pyplot as pyplot
 pyplot.plot( np.loadtxt("data/somedatafile.dat") )
 pyplot.show()
Done! In four lines of code I have my plot. I love IPython, numpy and matplotlib, they allow you to get things done really fast. I also love that IPython even auto-completes file paths, so very handy :-).
After a while playing with the Arduino I’ve become interested in Processing which is what the Arduino language and Arduino IDE is based on. Just as the Arduino is a thin layer on top of C, Processing is simply a library for Java that makes playing with computer graphics much easier. So today I’ve decided to play around with it a bit and write about it.
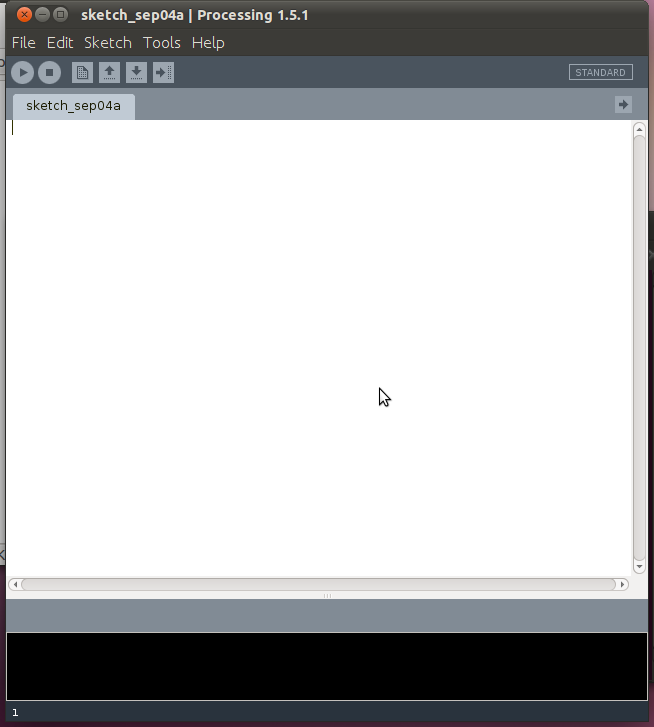
First of all I downloaded the Processing IDE from the Processing website, I downloaded the Linux version as I’m using Ubuntu but you can get a Windows or Mac OSX version as well. Then I decompressed the files and fired up the IDE by executing the “processing” file, I was then greeted by the IDE.
The Processing IDE
Looks good eh?? It looks almost idendical to the Arduino IDE. I then has a quick read through some of the documentation on the website. The first code snippet I ran was from Processing own tutorial, although I left a small bit of code out. The code for it is below, what it does is draw a circle wherever the mouse cursor currently is.
Yay, it worked!! I love how exciting it is to get instant feedback. I wasn’t sure exactly what the smooth() function did,
I suspected it may have been something to do with anti-aliasing and it turns out I was right after looking at the reference. As you can see from the screen shot it can be used to make pretty snaking patterns.
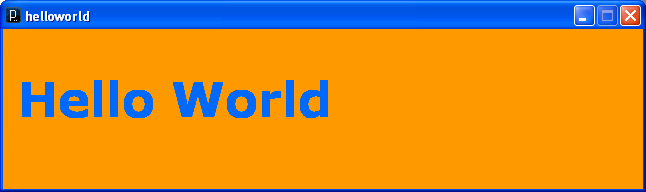
I decided that I wanted to create a sketch that printed “Hello World” because that’s the first program most people write :-). I had a quick look around the documentation on the website and I found the text() function and some example code. I typed that into the IDE but I wanted to use a bigger font, it turns out the font file must be in the /data directory of the sketch.
There is a tool provided that will take a font on your computer and turn it into something Processing can use. To use this tool, go to the “Tools” menu and select “Create Font…” and then in the dialog box that pops up select the font you want and the filename then click OK.
Clicking the run button produces a large window with “Hello World” written in large letters. It worked! Yay!!! So far it’s been pretty fun playing around with Processing, I hope to do a lot more with it. I want to use it to talk to the Arduino. Perhaps plotting the voltage on the analogue pins over time.
That’s it for now, I hope to have another post on this later in the week. See ya!
Well it’s time for another post. A couple of weeks ago I was working on an interface program for a rig at work. We were adding some extra features to a controller board and I thought while I was working on that I might as well make some changes to the interface program as well. The feature I wanted to add to the program was to make it format some of the numbers that are displayed in the UI using SI prefixes and with units of measure.
So after a quick look on the web to see if I can find some example code on how to do this, I decided to have a go writing the code on my own without looking at other stuff too much. This is what I came up with, It’s a function written in C# that can be used to convert floating point numbers to formatted strings. So the number 0.102 will be printed as “102m”, and it can append units to the end like this – “102mA”.
public static string FormatStringEng(double input, string units, string format)
{
    string prefix = "";
    double value = 0.0;

    if (input >= 1e+12 && input < 1e+15) {
        prefix = "T"; value = (input / 1e+12);    // Tera (1e+12)
    } else if (input >= 1e+9 && input < 1e+12) {
        prefix = "G"; value = (input / 1e+9);     // Giga (1e+9
    } else if (input >= 1e+6 && input < 1e+9) {
        prefix = "M"; value = (input / 1e+6);     // Mega (1e+6)
    } else if (input >= 1e+3 && input < 1e+6) {
        prefix = "k"; value = (input / 1e+3);     // Kilo (1e+3)
    } else if ((input >= 1) && (input < 1e+6)) {
        prefix = ""; value = input;               // Unity
    } else if (input >= 1e-3 && input < 1) {
        prefix = "m"; value = (input * 1e+3);     // Milli (1e-3)
    } else if (input >= 1e-6 && input < 1e-3) {
        prefix = "μ"; value = (input * 1e+6);     // Micro (1e-6)
    } else if (input >= 1e-9 && input < 1e-6) {
        prefix = "n"; value = (input * 1e+9);     // Nano (1e-9)
    } else if (input >= 1e-12 && input < 1e-9) {
        prefix = "p"; value = (input * 1e+12);    // Pico (1e-12)
    } else if (input >= 1e-15 && input < 1e-12) {
        prefix = "f"; value = (input * 1e+15);    // Fempto (1e-15)
    }

    return value.ToString() + prefix + units;
}
This code is working quite well so far. Haven’t had any problems with it… yet anyway. That’s it for now, see ya!
We use cookies on our website to give you the most relevant experience by remembering your preferences and repeat visits. By clicking “Accept All”, you consent to the use of ALL the cookies. However, you may visit "Cookie Settings" to provide a controlled consent.
This website uses cookies to improve your experience while you navigate through the website. Out of these, the cookies that are categorized as necessary are stored on your browser as they are essential for the working of basic functionalities of the website. We also use third-party cookies that help us analyze and understand how you use this website. These cookies will be stored in your browser only with your consent. You also have the option to opt-out of these cookies. But opting out of some of these cookies may affect your browsing experience.
Necessary cookies are absolutely essential for the website to function properly. These cookies ensure basic functionalities and security features of the website, anonymously.
Cookie
Duration
Description
cookielawinfo-checkbox-analytics
11 months
This cookie is set by GDPR Cookie Consent plugin. The cookie is used to store the user consent for the cookies in the category "Analytics".
cookielawinfo-checkbox-functional
11 months
The cookie is set by GDPR cookie consent to record the user consent for the cookies in the category "Functional".
cookielawinfo-checkbox-necessary
11 months
This cookie is set by GDPR Cookie Consent plugin. The cookies is used to store the user consent for the cookies in the category "Necessary".
cookielawinfo-checkbox-others
11 months
This cookie is set by GDPR Cookie Consent plugin. The cookie is used to store the user consent for the cookies in the category "Other.
cookielawinfo-checkbox-performance
11 months
This cookie is set by GDPR Cookie Consent plugin. The cookie is used to store the user consent for the cookies in the category "Performance".
viewed_cookie_policy
11 months
The cookie is set by the GDPR Cookie Consent plugin and is used to store whether or not user has consented to the use of cookies. It does not store any personal data.
Functional cookies help to perform certain functionalities like sharing the content of the website on social media platforms, collect feedbacks, and other third-party features.
Performance cookies are used to understand and analyze the key performance indexes of the website which helps in delivering a better user experience for the visitors.
Analytical cookies are used to understand how visitors interact with the website. These cookies help provide information on metrics the number of visitors, bounce rate, traffic source, etc.
Advertisement cookies are used to provide visitors with relevant ads and marketing campaigns. These cookies track visitors across websites and collect information to provide customized ads.